
|
|
| Radar/Satellite images courtesy of NOAA/NWS and Weather Underground. | |
| Updated: 05-Jun-2026 2:50pm - next full update at 2:55pm PDT (-7 hrs UTC) | ||||||||||||||||||||||||||||||||||||||||||||||||||
| Summary / Temperature | Wind | * Rain | Outlook | |||||||||||||||||||||||||||||||||||||||||||||||
|
|
|
|
|||||||||||||||||||||||||||||||||||||||||||||||
| Humidity | Almanac | Moon | ||||||||||||||||||||||||||||||||||||||||||||||||
|
|
|
||||||||||||||||||||||||||||||||||||||||||||||||


| UV Index | Solar Radiation | Fire Risk | ||||
|
7.0 Sunburn in 16 Minutes UV Chart |
|
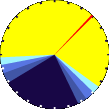
Highest: 12:54 PM 7.9 |
786 W/m2 89 % W/m2 ⇒ SI |
|
Highest: 11:26 AM 993 |
 Wildfire Danger Map Fire Danger Class Descriptions Fire Danger Icons Courtesy of: ODF |
| Air Quality Index (AQI) | Evapotranspiration (ET) | Cloud Base Height |
Quality Index6: 16  AQI Scale and Color Legend |
Current ET: 0.14 in. Current ET Rate: 0.26 in. Month ET: 1.09 in. Year ET: 15.39 in. Soil Moisture Deficit Since 01/01/2026: 43.45 in. (est.) 
|
5379ft ASL |
| Gorge-East Web Cam | CONUS Storm Predictions | National Forecast Chart |

|

|

|
| <-- Click Image(s) for Larger View --> |
| WU/TWC Latest Forecast - Date: Fri, 05 Jun 2026 21:47:29 GMT (-7 hrs for PDT) | ||||||
|
||||||

| Station Weather Bulletin(s) |
| * Snow Melt in the Rain Gauge is measured as "Rain" --- |